If we look at the Single family home market in Kapahulu, over the past two years, closing volume in 2024 is down 12.5% of what is was in 2023. Clearly a visible market slow down with rising interest rates.
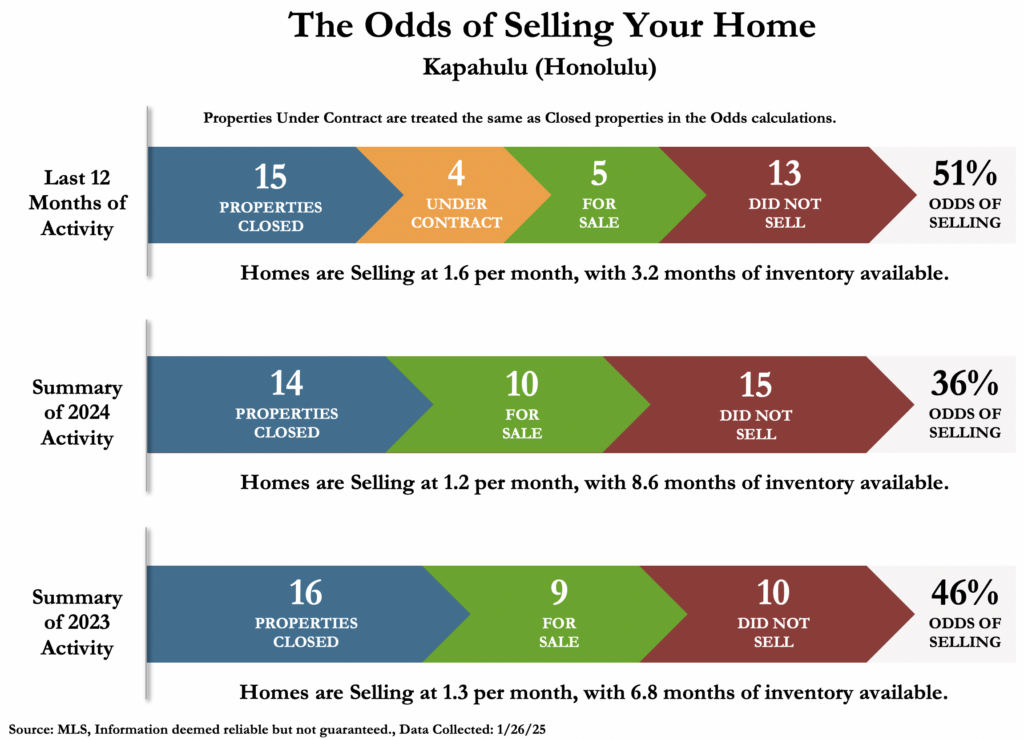
These charts represent all single family home closings in Kapahulu over the past 2 years. In the Odds of Selling Chart, we can see that in 2023, 16 properties sold (blue), 9 properties were still “for sale” at year’s end (green) and 10 units “did not sell” (red). Units were selling at a rate of 1.3/month and there was 6.8 months of supply of inventory (balanced). Given these numbers, you had a 46% odds of selling in 2023.
In 2024, 14 houses closed (down 12.5% over the previous year), 10 units were active on the market at year end (green) and 15 units “did not sell” (red). The units were selling at 1.2/month (about the same as in 2023) and there was 8.6 months of inventory on the market (up 27% – “buyer’s market”). Odds of selling are down 10%.
6 months of supply is considered a balanced market and less than 6 months is considered a seller’s market. In summary, over the past two years, we see a slow down in sale’s volume, an overall increase in supply, decreased selling rate and a decrease in odds of selling.
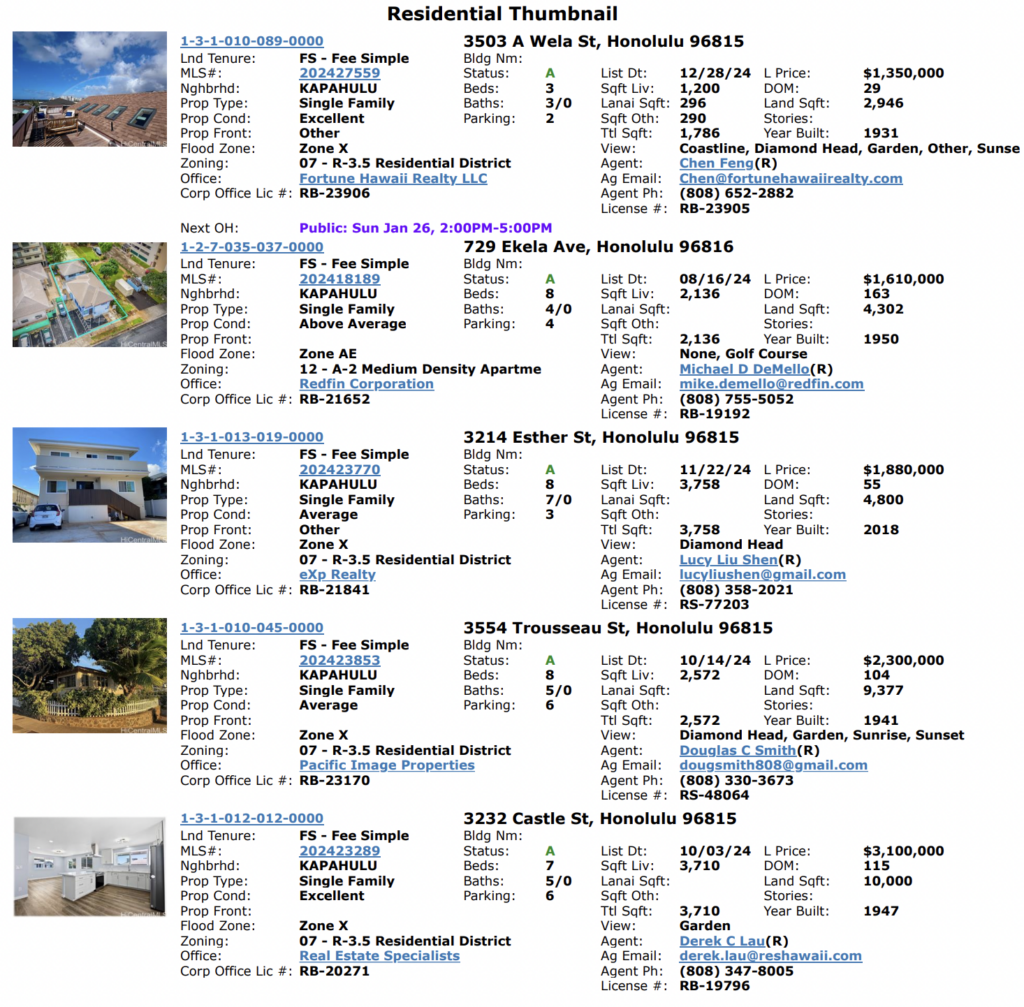
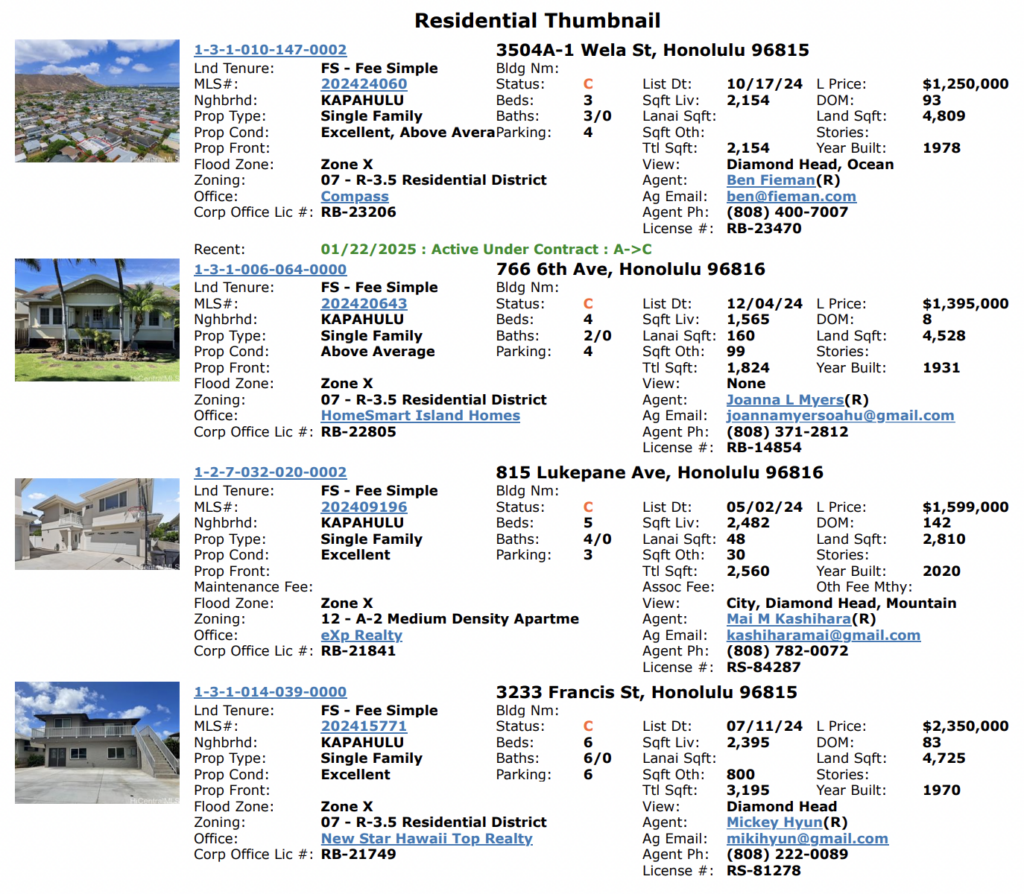
These are the 5 active listings on the market.
Three recent closings: We priced our Wilhelmina listing at $1,288M and it was bid up to $1.35M. Mariners Village 3, priced at $670k and bid up to $700k. Naniwa Gardens, we priced at $630k and were bid up to $675k. It is much better to be under market and get bid up, than to sit on the market and reduce price and waste time. We have two current listings in Waikiki, where we started our prices too high and reduced price through out the year. They have been on the market since last Christmas. We ended up adding new kitchens, last month, in each unit and reducing price again. Finally we got both of these units in escrow and hopefully closing in a few weeks. AlohaLani.net
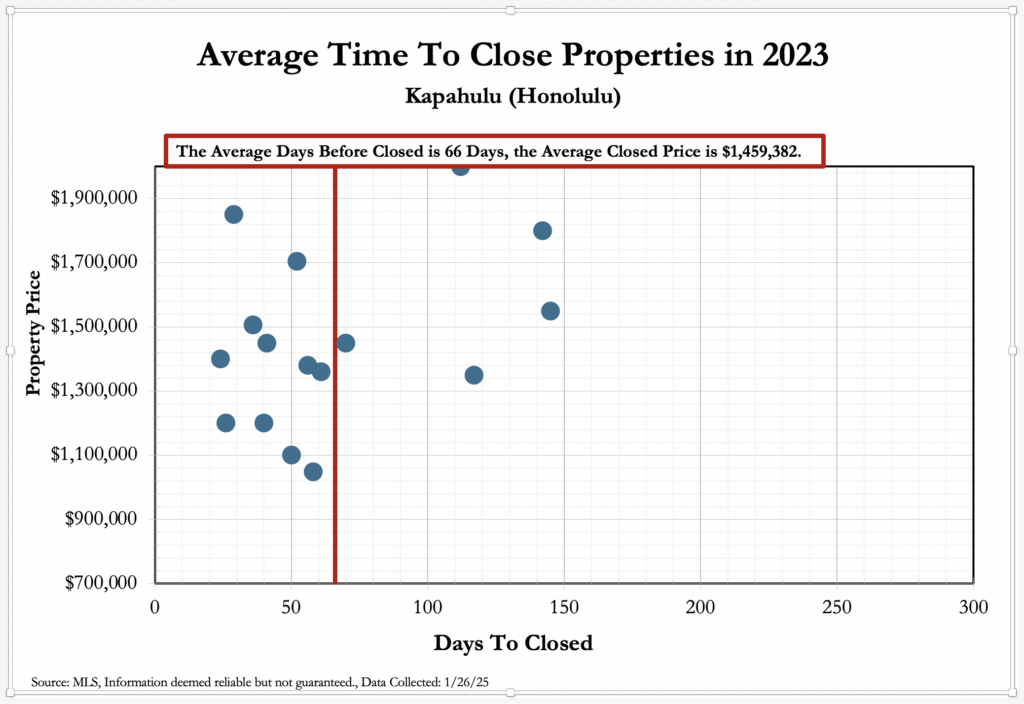
In 2023, it took an average of 66 days to close a single family home in Kapahulu for an average sales price of $1,459,382.
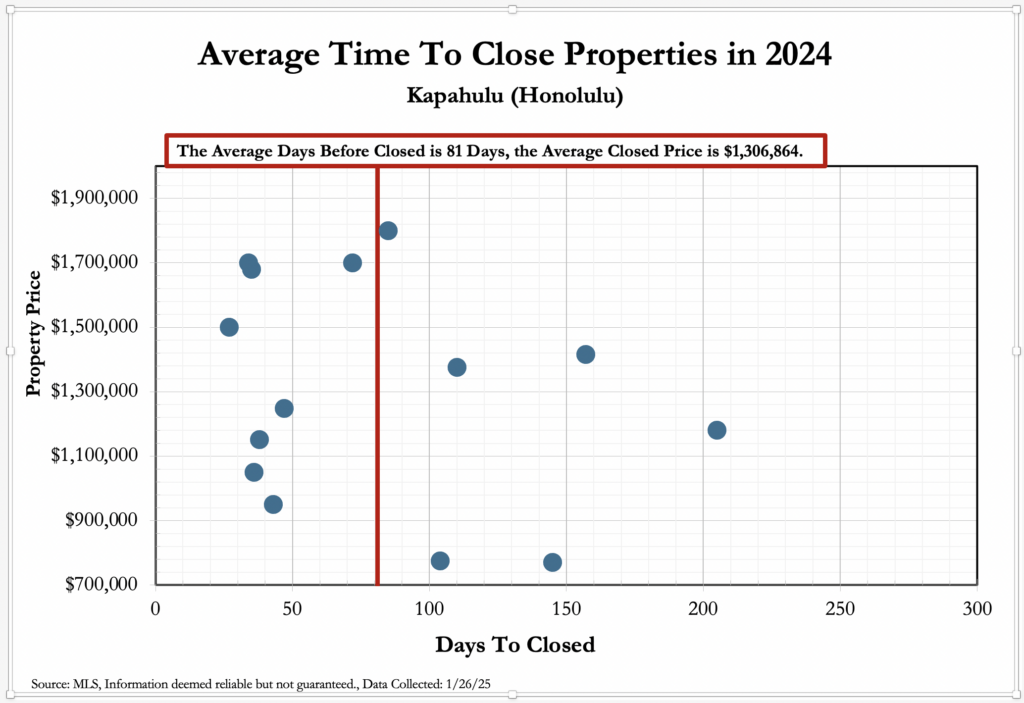
In 2024, it took 81 days to close a unit (23% longer) for an average price of $1,306,864 (down 11%)
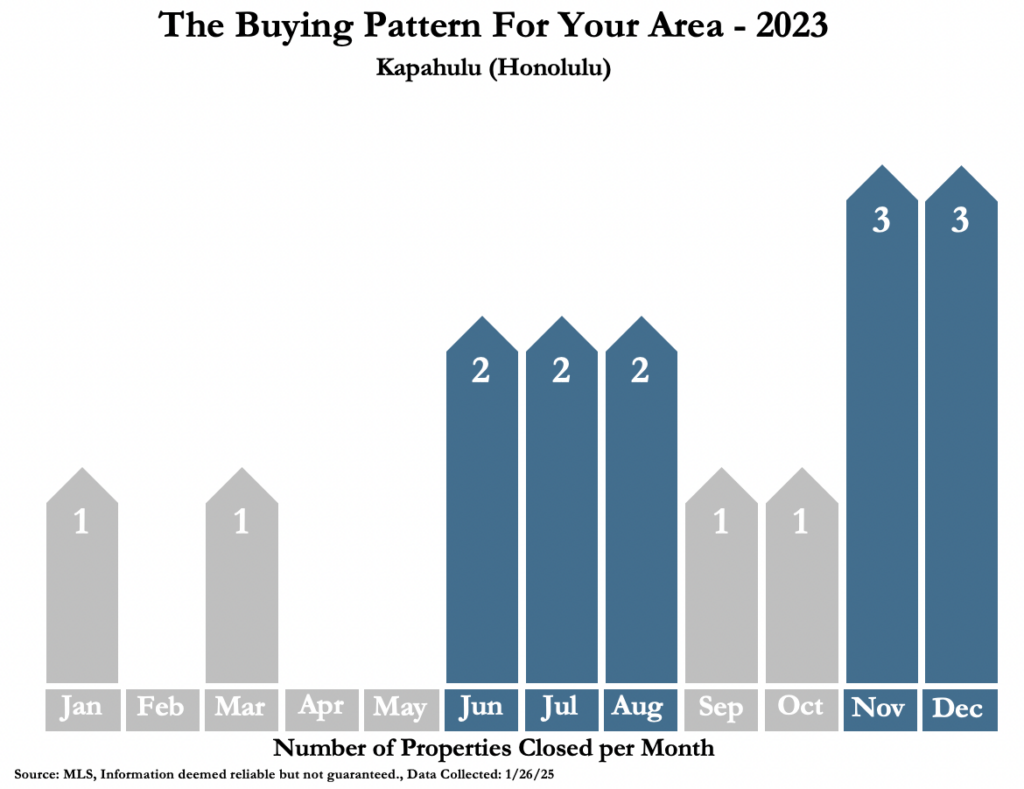
The Buying Patterns chart shows how the 16 closings of 2023 were dispersed throughout the year. In 2023, we saw the majority of activity occur in the summer time & winter (blue), which is typical and referred to as the “summer selling season.” The 6 closings in the summer is not typical. The 4th quarter is usually the slowest quarter of the entire year, because people are busy with holiday parties and travel.
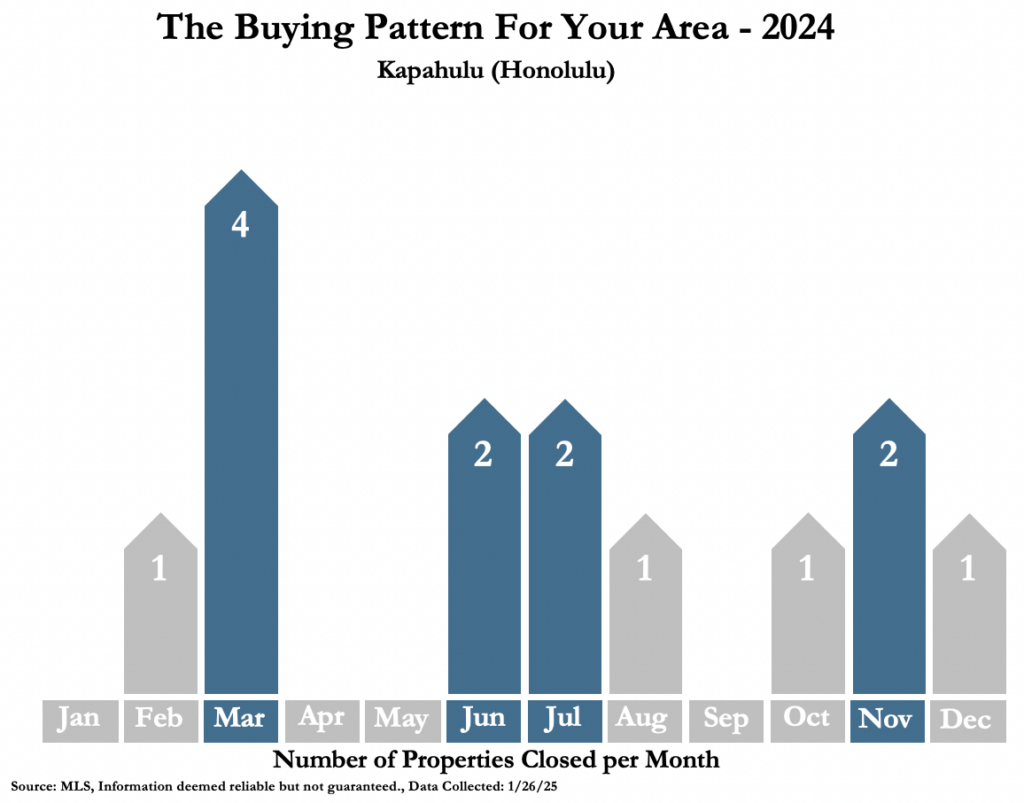
In 2024, Kapahulu had 14 closings. These closings were again concentrated in the summer selling months with a spike in the Spring time. Kind of all over the place, but consistently having a lot of closings in the summer. This closing data is based upon the date in which the house closed. If we assume an average escrow of 30 to 45 days and that June/July had the most closings this year, then March-May would be the best months to sell property. There are currently 4 properties in escrow.
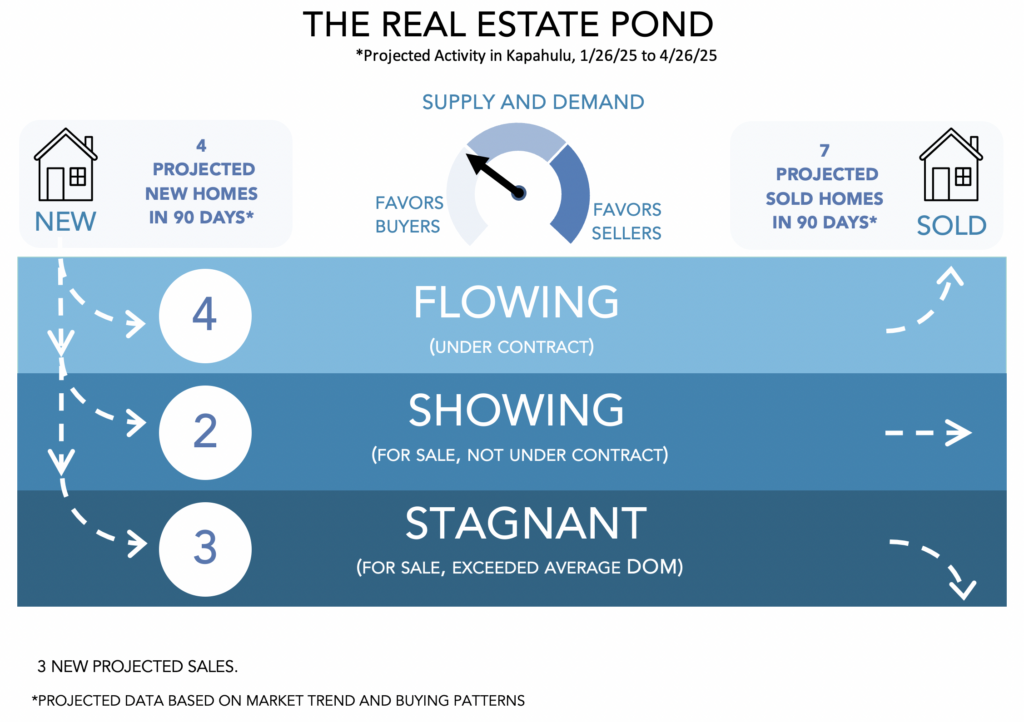
The pond analysis chart tries to take the past 2 years of data and try to predict the next 90 days. It is projected that 4 new houses will come on the market in Kapahulu and there will be 7 closings. The pond tries to illustrate how properties come on the market on the left and hopefully “flow” across the pond, find a buyer and then exit the pond as a sale to the right. The 4 properties that are “flowing” are the current 4 escrows. Then deeper in the pond, where the water is not moving as quickly, are properties that are still for sale and have not found a buyer. These properties are either over priced, under marketed or perhaps difficult to see. Difficult to see properties can include tenant/owner occupied listings. With a tenant, potential buyers need to give 48 hours notice to show, so showings are difficult
Please click this link for more statistics on the broader Hawaii Real Estate market